TRUCKEE, CA--(Marketwire - Oct 6, 2011) - Clear Capital (www.clearcapital.com) has released its monthly Home Data Index™ (HDI) Market Report, with news of U.S. home price gains of 3.5 percent comparing the most current rolling quarter through September, to the previous one. Also, the company published its first glimpse into 2012, providing a forecast through the first quarter, and while prices increased this most recent quarter, the company forecasts a small skid in prices for the fourth quarter of 2011, and a continued slide in home prices through the end of the first quarter of 2012.
Report highlights include:
- U.S. quarter-over-quarter home price gains continue to soften, posting a 3.5% increase, vs. growth of 4.0% reported in September's report.
- Year-over-year price changes remain negative at -3.8%.
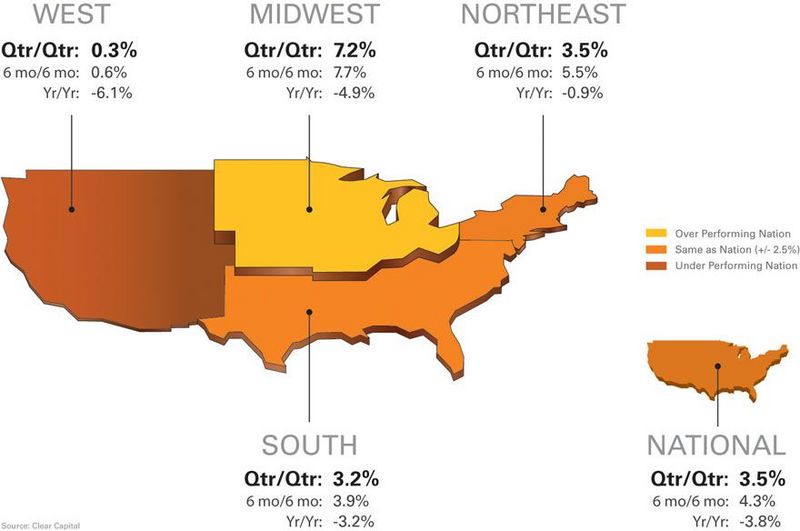
- At the regional level, the Midwest continues to lead the nation with a quarterly home price gain of 7.2%, followed by the Northeast at 3.5%, South at 3.2% and West at 0.3%.
- The Clear Capital forecast predicts U.S. home prices to drop 1.6% over the last three months of 2011, and 3.2% by the end of Q1 2012.
- This projected drop through Q1 2012 moves prices closer to Q1 2011 prices, the lowest since the downturn began.
"The September home price measures show continued slowing of the price gains we've seen this year, especially across the spring and summer months," said Dr. Alex Villacorta, Director of Research and Analytics at Clear Capital. "The housing market has yet to demonstrate the fundamentals necessary to overcome a seasonal slowdown over the next six months, which drives our projected 3.2 percent drop in national home prices through the first quarter of 2012.
"The normally positive market forces of record low mortgage rates and near record lows in home prices are being offset by high unemployment rates and general consumer pessimism about the economic future," said Villacorta. "Until we experience a more stable economic environment, I expect home prices to remain relatively flat or slightly down for the foreseeable future."
| Regional Market Overview (Sept. 2010 - Oct. 2011) | ||||||
| Qtr/Qtr % +/- | 6 mo/6 mo | Yr/Yr | ||||
| West | 0.3% | 0.6% | -6.1% | |||
| Midwest | 7.2% | 7.7% | -4.9% | |||
| Northeast | 3.5% | 5.5% | -0.9% | |||
| South | 3.2% | 3.9% | -3.2% | |||
| National | 3.5% | 4.3% | -3.8% | |||
Summer Price Momentum Continues To Fade
- The Midwest maintains its strong gains, outperforming the rest of the nation with a 7.2% price change.
- REO saturation eases across the U.S., with distressed sales taking place in only 1-in-4 homes (25.3%).
Data shows that since mid-spring, national rolling quarter-over-quarter prices gained 3.5 percent through September, compared to 4.0 percent change reported through August. Although prices are still up, the tide appears to be turning and these gains are expected to halt as early as next month. The resurgence in home price values over the last four months is best explained as the bounce back from the double dip observed in the first quarter of this year. As market prices move farther away from that low point, quarterly price changes will reflect the slowdown in price growth and yearly home price changes will show the stagnant environment that the market is in presently.
At the regional level, home prices in the West are sluggish with quarterly gains of a mere 0.3 percent over the period. Price movements in the Midwest and South are virtually unchanged from last month, when quarterly prices were up 7.3 percent and 3.5 percent, respectively. The quarterly 3.5 percent price gain experienced in the Northeast was a considerable cooling off from the 4.9 percent gains reported for the region last month.
When rolling year-over-year numbers are considered, prices across the nation were down -3.8 percent from September 2010. While the nation is still struggling with year-over-year losses, one bit of good news is that the Midwest was able to recover from the -9.8 percent yearly decline posted last month with a decrease this month of -4.9 percent, putting it more in line with the rest of the nation.
REO saturation continues to improve across the country with only slightly more than one-quarter of homes (25.3%) selling as distressed. This rate is down 9.2 percentage points since May and down 15.6 percentage points since it peaked in Q1 2009. The current REO saturation rate is an encouraging sign that the summer buying season saw increased sales in the non-distressed segment, which helped support price growth.
15 Highest and Lowest Performing Metro Markets (Sept. 2010 - Oct. 2011)
| Highest Performing Major Markets | ||||||||
| Qtr/Qtr Rank |
Metropolitan Statistical Area | Qtr/Qtr % +/- |
Yr/Yr | REO Saturation | ||||
| 1 | Cleveland, OH - Elyria, OH - Mentor, OH | 18.2% | 1.2% | 30.8% | ||||
| 2 | New Orleans, LA - Metairie, LA - Kenner, LA | 11.2% | -1.8% | 19.2% | ||||
| 3 | Chicago, IL - Naperville, IL - Joliet, IL | 10.4% | -3.4% | 27.5% | ||||
| 4 | Columbus, OH | 10.1% | -6.4% | 33.9% | ||||
| 5 | Hartford, CT - West Hartford, CT - East Hartford, CT | 8.9% | -4.5% | 5.1% | ||||
| 6 | Milwaukee, WI - Waukesha, WI - West Allis, WI | 8.6% | -8.4% | 22.2% | ||||
| 7 | Washington, DC - Arlington, VA - Alexandria, VA | 8.5% | 2.5% | 13.1% | ||||
| 8 | Minneapolis, MN - St. Paul, MN - Bloomington, MN | 7.5% | -7.3% | 36.2% | ||||
| 9 | Boston, MA - Cambridge, MA - Quincy, MA | 7.3% | 0.5% | 7.1% | ||||
| 10 | Charlotte, NC - Gastonia, NC - Concord, NC | 6.3% | -2.6% | 14.2% | ||||
| 11 | Cincinnati, OH - Middletown, OH | 6.2% | -3.2% | 20.1% | ||||
| 12 | Honolulu, HI | 5.7% | 1.1% | 8.2% | ||||
| 13 | Pittsburgh, PA | 5.5% | 4.3% | 5.7% | ||||
| 14 | Richmond, VA | 5.2% | -6.9% | 15.8% | ||||
| 15 | St. Louis, MO | 5.0% | -3.3% | 25.3% | ||||
Highest Performing Markets: The Midwest Showing Its Meddle
- Seven of the 15 highest performing markets (from the 50 markets covered) are from the Midwest region.
- Cleveland continues to impress as the highest performing market for the second month in a row.
The Midwest markets held their ground at the top of the highest performing markets list with seven metro markets represented. Cleveland maintains its momentum as the highest performing market in this quarter with an 18.2 percent increase in prices, with Chicago and Columbus in the third and fourth positions. Cleveland's return to the top of this list underscores the positive yearly gains for this low-priced and volatile market. Overall, New Orleans and Columbus were the largest movers compared to last month. New Orleans was up 4.9 percentage points to post 11.2 percent quarterly gains, while Columbus jumped 7.0 percentage points to post 10.1 percentage point gains. In the West, markets have stubbornly resisted the short term gains of the summertime home buying season, with Honolulu flying solo amongst the highest performing markets.
| Lowest Performing Major Markets | ||||||||
| Qtr/Qtr Rank |
Metropolitan Statistical Area | Qtr/Qtr % +/- |
Yr/Yr | REO Saturation | ||||
| 1 | Las Vegas, NV - Paradise, NV | -1.7% | -10.6% | 48.7% | ||||
| 2 | Tucson, AZ | -1.6% | -12.5% | 41.2% | ||||
| 3 | Riverside, CA - San Bernardino, CA - Ontario, CA | -1.5% | -3.9% | 43.2% | ||||
| 4 | Los Angeles, CA - Long Beach, CA - Santa Ana, CA | -1.3% | -3.2% | 26.8% | ||||
| 5 | San Diego, CA - Carlsbad, CA - San Marcos, CA | -1.2% | -3.8% | 27.0% | ||||
| 6 | Rochester, NY | -0.9% | -0.2% | 4.4% | ||||
| 7 | Seattle, WA - Tacoma, WA - Bellevue, WA | -0.4% | -14.2% | 20.5% | ||||
| 8 | San Jose, CA - Sunnyvale, CA - Santa Clara, CA | -0.2% | -4.4% | 17.1% | ||||
| 9 | San Francisco, CA - Oakland, CA - Fremont, CA | 0.0% | -6.1% | 24.8% | ||||
| 10 | Sacramento, CA - Arden, CA - Roseville, CA | 0.1% | -8.4% | 36.3% | ||||
| 11 | Detroit, MI - Warren, MI - Livonia, MI | 0.4% | -14.5% | 49.3% | ||||
| 12 | Philadelphia, PA - Camden, NJ - Wilmington, DE | 0.9% | -5.6% | 9.3% | ||||
| 13 | Phoenix, AZ - Mesa, AZ - Scottsdale, AZ | 1.1% | -6.0% | 38.6% | ||||
| 14 | Houston, TX - Baytown, TX - Sugar Land, TX | 1.3% | -5.0% | 31.8% | ||||
| 15 | Fresno, CA | 1.4% | -9.6% | 40.9% | ||||
Lowest Performing Markets: The West Is Not So Sunny
- The West region represents 11 of the 15 lowest performing markets.
- As a whole, this month's "bottom 15" showed improvement as their quarterly prices changes approached flat or even positive gains. Steepest drop of -1.7% was slightly better than last month's most severe drop of -2.7%.
Las Vegas was the hardest hit in this month's numbers, with a -1.7 percent price change over the most recent rolling quarter. However, Detroit has deteriorated the most over the long run with a -14.5 percent year-over-year price change.
Performance in the West remains dismal, with the vast majority of the 15 lowest performers coming from this region, including all seven of the California markets reported on. However, it is important to note that while California is over-represented in our lowest performing 15 markets this month, the magnitude of yearly declines and overall volatility for that market has been mild relative to recent years.
On a positive note, the lowest performing markets experienced a collective improvement this month as the spread of quarterly price changes narrowed, ranging from -1.7 percent to 1.4 percent, when compared to recent market reports. Further, the number of markets returning double digit yearly declines has dropped to only four, while REO saturation rates continued to decline by an average of 0.7 percentage points from last month's report.
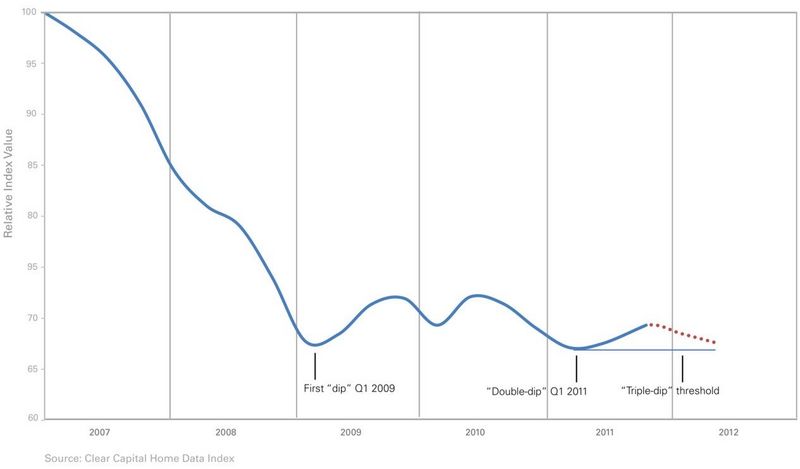
Clear Capital's U.S. Home Prices Forecast to Bounce Toward the Bottom, But Remain Just Above Triple-dip Territory
As the markets enter the fall season and brace for the traditionally slow winter season, our home price forecast models suggest an additional 1.6 percent decline in U.S. home prices over the last three months of 2011. If prices follow this expected trajectory, 2011 will have experienced a 1.0 percent decline for the calendar year and a 1.4 percent gain since the first dip in 2009. Barring any new shocks to the market, these modest price movements are anticipated to continue with little reason to expect big gains or losses through the next couple of years. Looking ahead to 2012, our pricing models project home prices will continue their modest slide with additional declines through the first quarter (See chart titled, "National Year-Over-Year Home Price Change" at right).
If the economy does fall back into its second recessionary period since 2006, there is strong potential for a triple-dip in the housing market. However, assuming prices remain on current trajectories, our models forecast U.S. home price changes of -3.2 percent over the next six months, and year-over-year price changes to eek out gains in the first quarter of 2012. In short, national prices may still see a positive yearly change since the rate of decline over the next six months is projected to be much slower than 7.7 percent decline national prices saw over the same period last year. This would be the first yearly gain reported since mid-2010 when buyers were capitalizing on the purchasing incentive of the home tax credit before it expired. Further, whereas the first "dip" in home prices occurred in the winter of 2009 and the "double-dip" in winter of 2010, a dreaded "triple-dip" is likely only to be flirted with, assuming there is not a major shock to the system in upcoming months.
Despite the strong rebound off winter's double-dip in home prices, where prices hit their lowest point since the first quarter of 2009 when the downturn began, the overall housing market remains in a very tenuous state. Positive and negative forces have seemingly canceled each other out leaving prices virtually stagnant. Record low mortgage rates and a wide selection of affordable homes has yet to counteract the negative pull of distressed sales and stubbornly high unemployment. The net effect of these counter forces places the housing market in a suspended state with price movement limited to a standard seasonal ebb and flow.
About the Clear Capital Home Data Index (HDI) Market Report
The Clear Capital HDI Market Report provides insights into market trends and other leading indices for the real estate market at the national and local levels. A critical difference in the value of the HDI Market Report is the capability of Clear Capital to provide more timely and granular reporting than other home price index providers.
The Clear Capital HDI Market Report:
- Offers the real estate industry (investors, lenders and servicers), government agencies and the public insight into the most recent pricing conditions, not only at the national and metropolitan level, but within local markets as well.
- Is built on the most recent information available from recorder/assessor offices, and then further enhanced by adding the company's proprietary streaming market data for the most comprehensive geographic coverage and local insights available.
- Reflects nationwide coverage of sales transactions and aggregates this comprehensive dataset at ten different geographic levels, including hundreds of metropolitan statistical areas (MSAs) and sub-ZIP code boundaries.
- Includes equally-weighted distressed bank owned sales (REOs) from around the country to give the most real world look of pricing dynamics across all sales types.
- Allows for the most current market data by providing more frequent updates with patent-pending rolling quarter technology. This ensures decisions are based on the most up-to-date information available.
Clear Capital Home Data Index™ Methodology
- Generates the timeliest indices in patent pending rolling quarter intervals that compare the most recent four months to the previous three months. The rolling quarters have no fixed start date and can be used to generate indices as data flows in, significantly reducing the multi-month lag time experienced with other indices.
- Includes both fair market and institutional (real estate owned) transactions, giving equal weight to all market transactions and identifying price tiers at a market specific level. By giving equal weight to all transactions the HDI is truly representative of each unique market.
- Results from an address-level cascade create an index with the most granular, statistically significant market area available.
- Provides weighted repeat sales, and price-per-square-foot index models that use multiple sale types, including single-family homes, multi-family homes and condominiums.
About Clear Capital
Clear Capital (www.clearcapital.com) is a premium provider of data and solutions for real estate asset valuation and risk assessment for large financial services companies. Our products include appraisals, broker-price opinions, property condition inspections, value reconciliations, and home data indices. Clear Capital's combination of progressive technology, high caliber in-house staff and a well-trained network of more than 40,000 field experts sets a new standard for accurate, up-to-date and well documented valuation data and assessments. The Company's customers include the largest U.S. banks, investment firms and other financial organizations.
Legend
Address Level Cascade -- Provides the most granular market data available. From the subject property, progressively steps out from the smallest market to larger markets until data density and statistical confidence are sufficient to return a market trend.
Home Data Index (HDI) -- Powerful analytics tool that provides contextual data augmenting other, human-based valuation tools. Clear Capital's multi-model approach combines address-level accuracy with the most current proprietary home pricing data available.
Metropolitan Statistical Area (MSA) -- Geographic entities defined by the U.S. Office of Management and Budget (OMB) for use by Federal statistical agencies in collecting, tabulating, and publishing Federal statistics.
Repeat Sales Model -- Weighted linear model based on repeat sales of same property over time.
Price Per Square Foot (PPSF) Model -- Median price movement of sale prices divided by square footage over a period of time -- most commonly a quarter.
Real Estate Owned (REO) Saturation -- Calculates the percentage of REOs sold as compared to all properties sold in the last rolling quarter.
Rolling Quarters -- Clear Capital uses patent pending rolling quarter intervals to compare the most recent three months and a fourth month of proprietary data against the previous three months. We include the most current fourth month of proprietary pricing data, because it often contains the most relevant and insightful information.
The information contained in this report is based on sources that are deemed to be reliable; however no representation or warranty is made as to the accuracy, completeness, or fitness for any particular purpose of any information contained herein. This report is not intended as investment advice, and should not be viewed as any guarantee of value, condition, or other attribute.
Contact Information:
Media Contact:
Michelle Sabolich
Atomic PR for Clear Capital
415.593.1400