TRUCKEE, CA--(Marketwire - September 9, 2010) - Clear Capital (www.clearcapital.com), a premium provider of data and solutions for real estate asset valuation, investment and risk assessment, today released its Home Data Index™ (HDI) Market Report with data through August 2010.
Report highlights include:
-
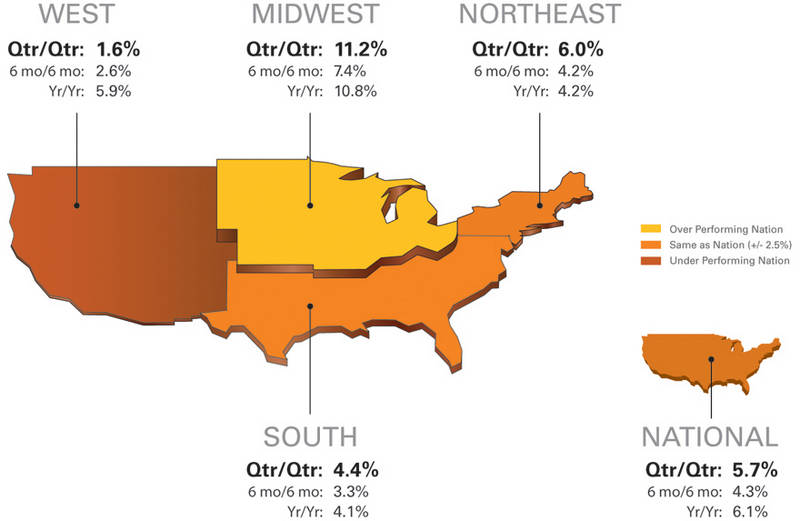
National / Four Region Overview: National quarter-over-quarter price gains (5.7%) were down 2.2 percentage points from last month's report. National year-over-year price gains remained positive, but slowed to 6.1 percent. Additionally, REO saturation dropped slightly to 22.1% for the nation, a slight 0.6 percentage point reduction from last month's report.
-
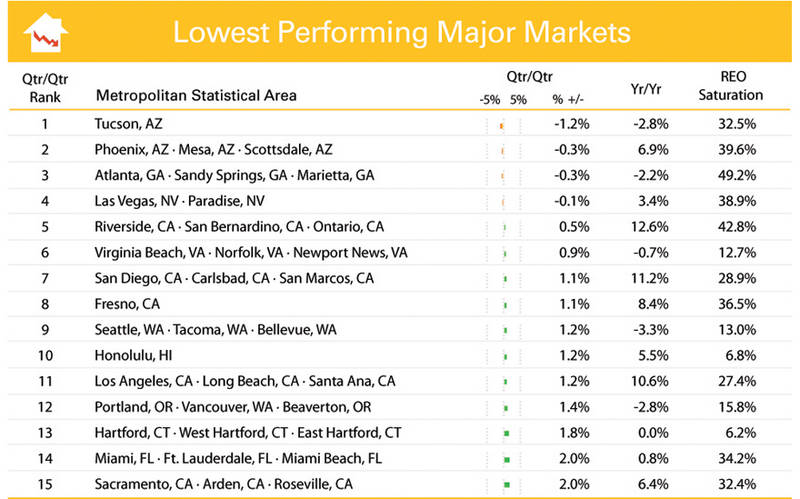
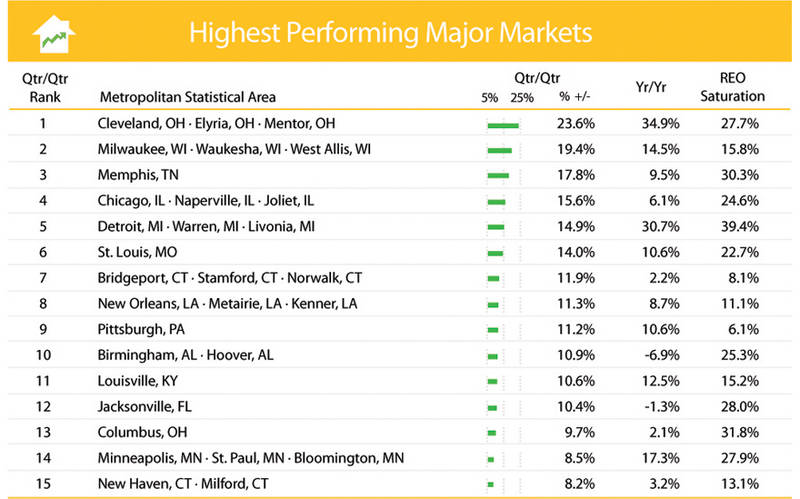
Metropolitan Statistical Area (MSA) drilldown: Many of the 15 highest performing major markets continue to post double-digit quarterly gains, represented largely by the volatile Midwest and South regions. However, 11 of these markets experienced softening quarterly price gains, shedding an average 6.1 percentage points off last month's report. Even markets leading our highest performing list are seeing big slowdowns: New Orleans, La., as well as the Ohio cities of Cleveland and Columbus, saw the largest slowdowns in yearly price gains -- each falling by more than seven percentage points.
-
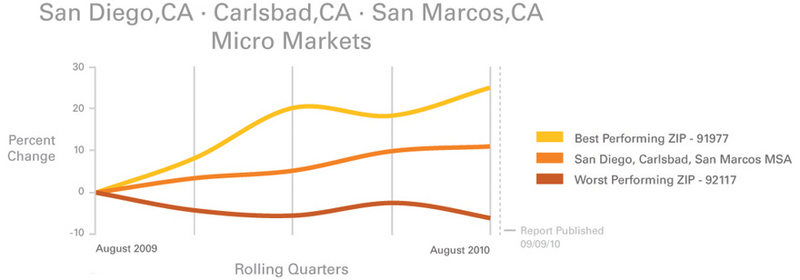
Micro Market Analysis: Home prices for the San Diego MSA stand 11.2 percent above their levels from this time last year. Coupled with relatively low volatility, this market continues to maintain price gains.
"We continue to see softening of home price gains, due in large part to the buyer pullback after the expiration of the tax credit," said Dr. Alex Villacorta, Senior Statistician, Clear Capital. "Overall, prices look poised to continue their deceleration with a likely drop into negative territory by the end of the year. But keep in mind, the price gains we experienced over the past two years are providing a cushion against prices going into double dip territory, meaning it is unlikely we'll see prices below their 2009 lows this year."
"As we head into the final months of the year it will be interesting to see how markets respond to an environment without any buyer incentives," added Dr. Villacorta. "We are observing local markets that are within a few miles of each other diverging in their response to the current housing climate -- some are showing strong stable growth and others have yet to reach a price bottom. All of this points to the fact that recovery in the housing market will occur segment by segment in micro markets around the country."
National/Four Region Market Overview (Aug. 2009 - Aug. 2010)
National quarter-over-quarter price gains (5.7%) slowed 2.2 percentage points from last month's report. To some, this might be another indication that the possible double dip has arrived. While local micro markets may face an eventual double dip, it's important to note that both quarterly and yearly prices at the national and regional levels are still up and price gains of the last year-and-a-half have created a buffer that will slow the development of a national double dip scenario.
For a national double-dip to occur, prices would need to drop below their 2009 lows. This would be a complete direction change and decline of 11.7 percent from current levels. Barring a meltdown reminiscent of late 2008, it is unlikely prices would reach new record lows before spring 2011.
Volatility continues in the Midwest and South regions where the greatest price swings occurred, while the West and Northeast remain more stable. The Midwest's quarterly gains of 11.2 percent were down 3.5 percentage points compared to what was reported last month. Similarly, the South was down 2.6 percentage points to its current 4.4 percent gain. The West and Northeast slowed by approximately one percentage point each.
National year-over-year price gains remained positive, but slowed to 6.1 percent. Additionally, REO saturation reached 22.1 percent for the nation, a slight 0.6 percentage point reduction from last month's report.
Metro Markets (Aug. 2009 - Aug. 2010)
Many of the highest performing major markets continue to post double digit quarterly gains, represented largely by the volatile Midwest and South regions. However, 11 of the top 15 markets experienced softening quarterly price gains, shedding an average 6.1 percentage points. Thirteen of these highest performing markets saw slowing yearly price gains, down an average 4.5 percentage points. New Orleans, La., as well as the Ohio cities of Cleveland and Columbus, saw the largest slowdown in year-over-year price gains -- each falling by more than seven percentage points.
Several of the markets in the above chart have maintained a significant price buffer against a double dip, while some haven't fared as well. Pittsburgh, Pa. is a great example of an area protected from a double dip. On a post tax credit peak, prices in Pittsburgh have risen 23.0 percent since its market lows in early 2009. With a quarterly rate of decline averaging just 2.8 percent since 2006, Pittsburgh will likely remain resistant to a double dip. On the other hand, Jacksonville, Fla. is currently up only 10.4 percent from its very recent low mark, necessitating a much smaller percentage point drop needed to reach its price bottom. When price declines occur in Jacksonville, recent history shows us that they fall on average by 5.2 percent per quarter. If such a rate of decline was to be re-introduced to this market, it would take nearly six months to completely erode a 10.4 percent buffer. Not surprisingly, this leaves Jacksonville more vulnerable to the double dip scenario than Pittsburgh.
REO saturation remained relatively flat for the 15 highest performing markets, posting a slight 0.6 percentage point improvement (i.e. drop) over last month's report. Only New Orleans, Louisville, Ky., and Columbus, Ohio gained more than one percentage point of REO saturation.
All 15 markets in the above chart experienced both slowing quarterly and yearly price gains. However, the recent stability of markets in the West region helped mute the price slowdown. Quarter-over-quarter and yearly price gains slowed on average 2.1 and 2.2 percentage points from last month's report, respectively. This slowdown was sufficient to re-introduce quarterly price declines in Tucson and Phoenix, Ariz., Atlanta, Ga. and Las Vegas, Nev.
Tucson's -1.2 percent quarterly price change secured it the number one position on the above list, which subsequently makes it the only market on the list to currently sit at its lowest price point since the 2006 market peak. With no substantive price gains over the last year (Tucson only returned a 0.6 percent quarterly gain this past spring), the question of a double dip is not applicable to this market.
Contrary to Tucson's declines, the San Diego MSA has built a stronger price buffer than any of the other markets on this list. With an average quarterly price change of -5.2 percent following its market peak, San Diego would likely need three quarters of steady declines to erode its 18.1 percent price gains since the market bottom. While San Diego's price buffer alone might not match some of the highest performing major markets, its price movements are fairly stable which lends support to current price levels. For more information on San Diego please see this month's micro market section.
Micro Markets (Aug. 2009 - Aug. 2010)
This section highlights a single market every month with a deeper dive into how the micro- and macro-markets relate to each other.
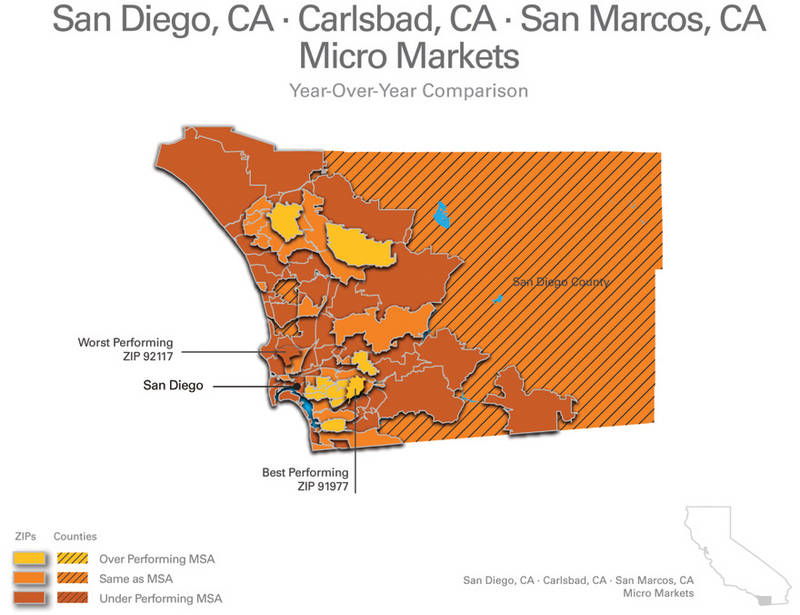
The San Diego metro area has maintained steady gains since its early 2009 trough, where home prices had eroded 50.1 percent from its market peak. With prices for the San Diego MSA 11.2 percent above their levels of this time last year, coupled with relatively low volatility, this market continues to maintain gains. REO saturation has fallen in-line with the price gains, decreasing from a peak of 54.6 percent in late 2008, to a current level of 28.9 percent.
The best performing micro market in San Diego is Spring Valley (ZIP code 91977). Like so many distressed markets, Spring Valley has enjoyed a significant price bump over the last year as homebuyers and investors looked for discounted deals. Strong buyer activity has consumed REO listings, helping lift prices of this lower-cost area 25.9 percent. However, these gains are on the heels of the 60 percent drop from its peak, highlighting the volatility present in this market. As of this report, REO saturation rates have been cut in half, currently resting at 36.1 percent.
The Claremont (ZIP 92117) micro market didn't fare as well, even though it's conveniently located north of downtown between the main corridors of Interstate 5 and Interstate 805 with access to two university centers. This micro market, the worst performing ZIP code in the San Diego area, has missed some of the recent gains experienced by other San Diego micro markets over the last year (prices have fallen a modest 5.0%). Claremont has, however, maintained a longer period of relative stability, experiencing its last major decline in early 2008.
While the greater San Diego MSA and lower-cost Spring Valley area were still facing double-digit declines through early 2009, prices in the Claremont area were similar to levels seen today. Having lost a more modest 35.3 percent off its market high, and despite lackluster gains over the past year, homes in the Claremont market have managed to recover 8.7 percent. Long standing residents and a convenient location have helped keep this market stable, a contrast to the more fleeting investor base of Spring Valley. So, while Spring Valley has seen more appreciation than Claremont, it has been more volatile in the recent years -- a concern for investors and home owners. In some respects, Claremont, albeit falling as of late, has not been as volatile and therefore is not in all respects a dangerous market.
About the Clear Capital Home Data Index (HDI) Market Report
The Clear Capital HDI Market Report offers the industry, investors and lenders a timely look at pricing conditions, not only at the national and metropolitan level, but within local markets as well. Patent pending rolling quarter technology significantly reduces the multi-month lag time associated with other indices to help investors, loan servicers and individual buyers and sellers make more informed, timely and profitable decisions. Clear Capital data is built on the most recent data available from recorder/assessor offices, and then further enhanced by adding the Company's proprietary market data for the most comprehensive geographic coverage available.
Clear Capital Home Data Index™ Methodology
The Clear Capital Home Data Index (HDI) provides weighted repeat sales, and price-per-square-foot index models that use multiple sale types, including single-family homes, multi-family homes and condominiums. These models are combined with an address-level cascade to provide sale-type-specific analysis for thousands of geographic areas across the country. The indices include both fair market and institutional (real estate owned) transactions. They also provide indicators of REO activity such as REO discount rates, REO days on market and REO saturation. The Clear Capital HDI generates indices in patent pending rolling quarter intervals that compare the most recent four months to the previous three months. The rolling quarters have no fixed start date and can be used to generate indices as data flows in, or at any arbitrary time period.
About Clear Capital
Clear Capital (www.clearcapital.com) is a premium provider of data and solutions for real estate asset valuation and risk assessment for large financial services companies. Our products include appraisals, broker-price opinions, property condition inspections, value reconciliations, and home data indices. Clear Capital's combination of progressive technology, high caliber in-house staff and a well-trained network of more than 40,000 field experts sets a new standard for accurate, up-to-date and well documented valuation data and assessments. The Company's customers include 75 percent of the largest U.S. banks, investment firms and other financial organizations.
Legend
Address Level Cascade -- Provides the most granular market data available. From the subject property, progressively steps out from the smallest market to larger markets until data density and statistical confidence are sufficient to return a market trend.
Home Data Index (HDI) -- Major intelligence offering that provides contextual data augmenting other, human-based valuation tools. Clear Capital's multi-model approach combines address-level accuracy with the most current proprietary home pricing data available.
Metropolitan Statistical Area (MSA) -- Geographic entities defined by the U.S. Office of Management and Budget (OMB) for use by Federal statistical agencies in collecting, tabulating, and publishing Federal statistics.
Repeat Sales Model -- Weighted linear model based on repeat sales of same property over time.
Price Per Square Foot (PPSF) Model -- Median price movement of sale prices divided by square footage over a period of time -- most commonly a quarter.
Real Estate Owned (REO) Saturation -- Calculates the percentage of REOs sold as compared to all properties sold in the last rolling quarter.
Rolling Quarters -- Patent pending rolling quarters compare the most recent four months to the previous three months.
The information contained in this report is based on sources that are deemed to be reliable; however no representation or warranty is made as to the accuracy, completeness, or fitness for any particular purpose of any information contained herein. This report is not intended as investment advice, and should not be viewed as any guarantee of value, condition, or other attribute.
Contact Information:
Media Contact:
Heather Pond
Atomic PR for Clear Capital
415.593.1400